
Decomposition of Georgia's Exports

Georgia has recently seen an uptick in its foreign trade figures, particularly in exports. This growth is notably driven by re-exports, which involve trade between different countries facilitated through Georgia.
In 2022, re-exports from Georgia surged by 69.6%, followed by a 74.5% growth rate in the subsequent year. However, during the same period, domestic exports experienced a decline of 24.4% in 2023.
Graph 1: Export of Goods from Georgia (USD Billion)
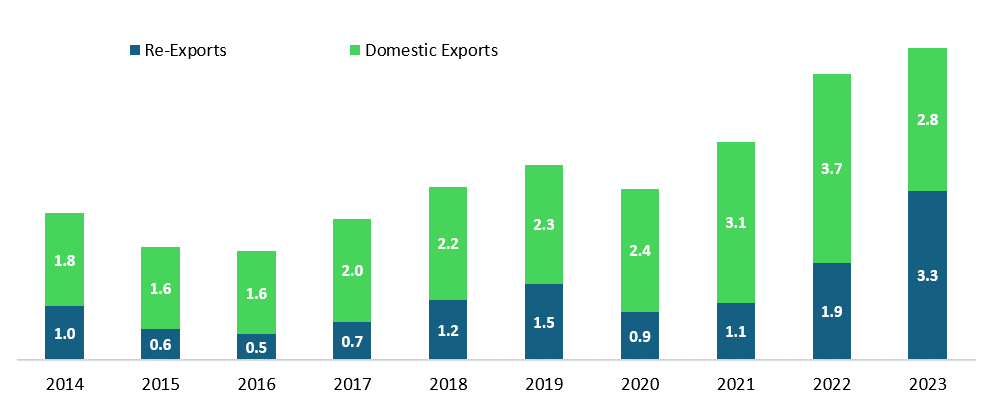
Source: National Statistics Office of Georgia
The decline in the value of domestic exports was most pronounced in trade with the EU. During this period, the export of goods from Georgia to EU member states contracted by 22.3%. In comparison, the decrease in Georgia’s trade with Commonwealth of Independent States (CIS) member states was only 3.1%.
Graph 2: Domestic Export from Georgia by Countries (USD Million)
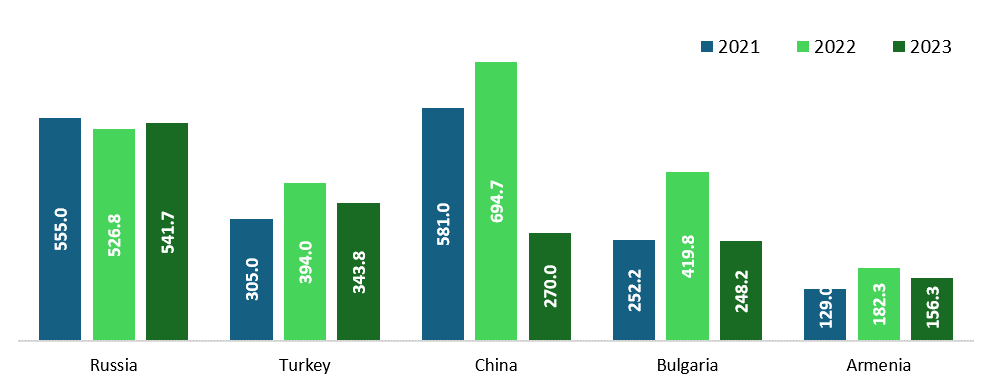
Source: National Statistics Office of Georgia
Furthermore, compared to the previous year, domestic exports from Georgia to Russia increased by 2.8%. During this period, the value of exported goods amounted to USD 541.7 million, constituting 19.4% of the total domestic exports. Thus, Russia has once again emerged as the main export destination for domestic goods.
With a share of 12.3%, Turkey is ranked second among Georgia’s top export partners, accounting for exports worth USD 343.3 million in 2023. This represents a decrease of 12.7% compared to the previous period.
In 2023, the Chinese market lost its position for Georgia’s domestic exports, which had gained ground amid the pandemic. Georgia’s exports to China dropped from USD 694.7 million to USD 270 million in 2023 (9.7% in domestic exports).
Exports Structure
Copper ores and concentrates constitute the primary export goods from Georgia. In 2022, approximately 437,800 tons of ores were exported, with a total value of USD 1,024.2 million. However, exports halved in the previous year. In 2023, the volume of copper ore exports amounted to 232,000 tons, which, given the plummeting export prices, was valued at USD 474.2 million.
There are only three countries that serve as export markets for copper ores: Bulgaria, China, and Spain. The decline in exports in the last year can be attributed to the Chinese market, where the volume of copper ore exports shrank from 251,600 tons to 97,700 tons.
Graph 3: Domestic Export from Georgia by Goods (USD Million)
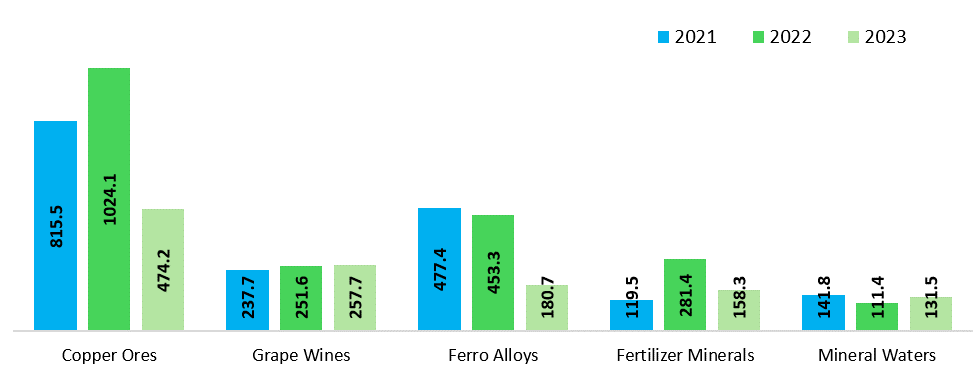
Source: National Statistics Office of Georgia
There has also been a decline in the exports of ferro-alloys. In 2023, a total of 157.2 thousand tons of ferro-alloys were exported, which is 71.5 thousand tons less compared to the previous year. During this period, the value of exported ferro-alloys decreased by 60.1%.
The situation differs for the second-ranked export goods. In 2023, approximately 89.4 million liters of wine were exported from Georgia, which is 12.2 million liters less than in 2022. However, due to the rise in the average export price, the total value of exported wine has increased. In 2023, the value of export of natural grape wines from Georgia reached USD 257.7 million, accounting for 9.2% of local exports.
Graph 4: Average Export Price for One Liter of Wine in Top Ten Export Countries (USD Million)
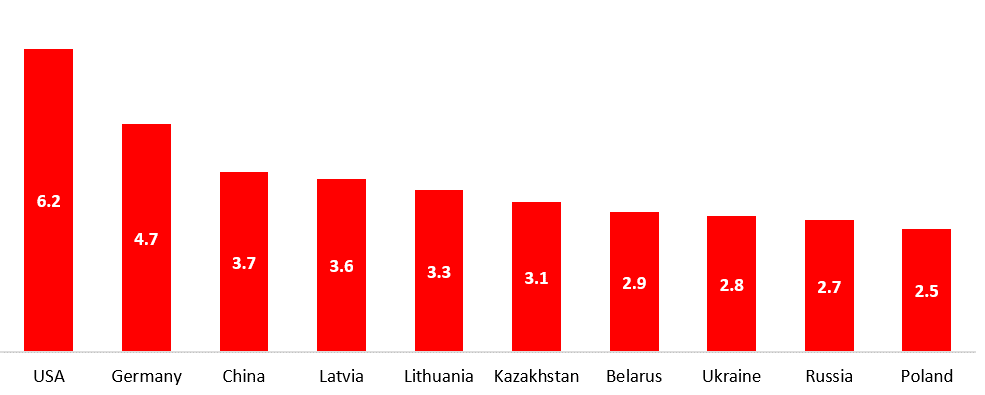
Source: National Statistics Office of Georgia; author’s calculations
The major export market for wine is Russia, which accounted for 69.6% of total wine exports in 2023, totaling 62.3 million liters. However, the average export price for one liter of wine to Russia is comparatively lower. The price is even lower in Poland, where six million liters of wine were exported in 2023. The following three countries – Ukraine, China, and Kazakhstan – account for 12.6% of wine exports.
Re-Exports
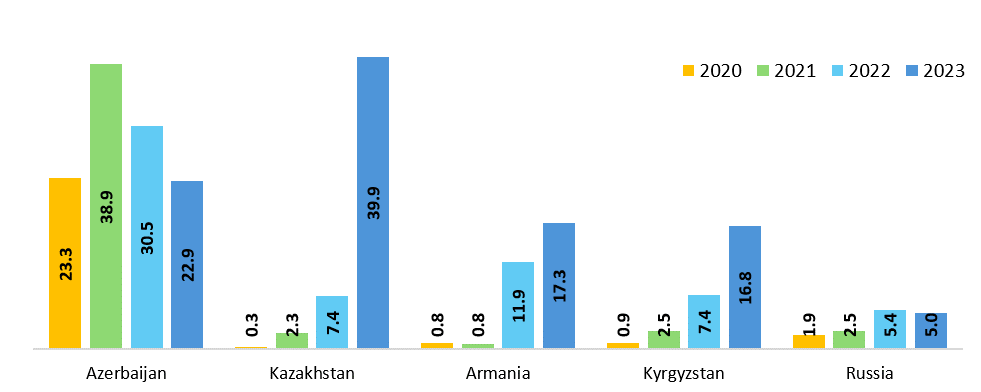
The increase in re-exports in 2023 is attributed to the export of passenger motor vehicles. In 2023, the total number of vehicles re-exported from Georgia amounted to 107,900, which is 28,000 more compared to 2022. During this period, the majority of vehicles, approximately 94.5%, were re-exported to five countries: Azerbaijan, Kazakhstan, Armenia, Kyrgyzstan, and Russia.
Graph 5: Re-Exports of Passenger Vehicles from Georgia (Thousands)
Source: National Statistics Office of Georgia
Remarkably, the re-exports of passenger motor vehicles from Georgia to Russia were relatively lower, at 5,000, but still double the pre-war level. It's important to note that the re-exports and transit of motor.
While motor vehicles are not directly re-exported to Russia, some of them ultimately end up in the Russian market. This occurs through the single market of the Eurasian Economic Union. Specifically, a motor vehicle imported to Georgia is exported to one of the EAEU member states, where, after customs procedures, it is then sent to Russia.
In 2023, approximately 39,900 passenger motor vehicles were re-exported from Georgia to Kazakhstan. Compared to the pre-war period, the number of re-exported cars has increased by a factor of 17.5. Even more significant growth in the number of re-exported cars – by a factor of 22.4% - was recorded from Georgia to Kyrgyzstan, while the re-exports of vehicles from Georgia to Armenia have nearly doubled.
***
The war between Russia and Ukraine has significantly changed Georgia’s export structure. Over the past year, local exports have decreased while re-exports have risen. The substantial increase in re-exports occurred due to the doubling of re-exports of passenger motor vehicles from Georgia to the Eurasian Economic Union member states. The decline in domestic exports, on the other hand, is attributed to a decrease in copper exports.
See the attached file for the entire document with relevant sources, links and explanations.